
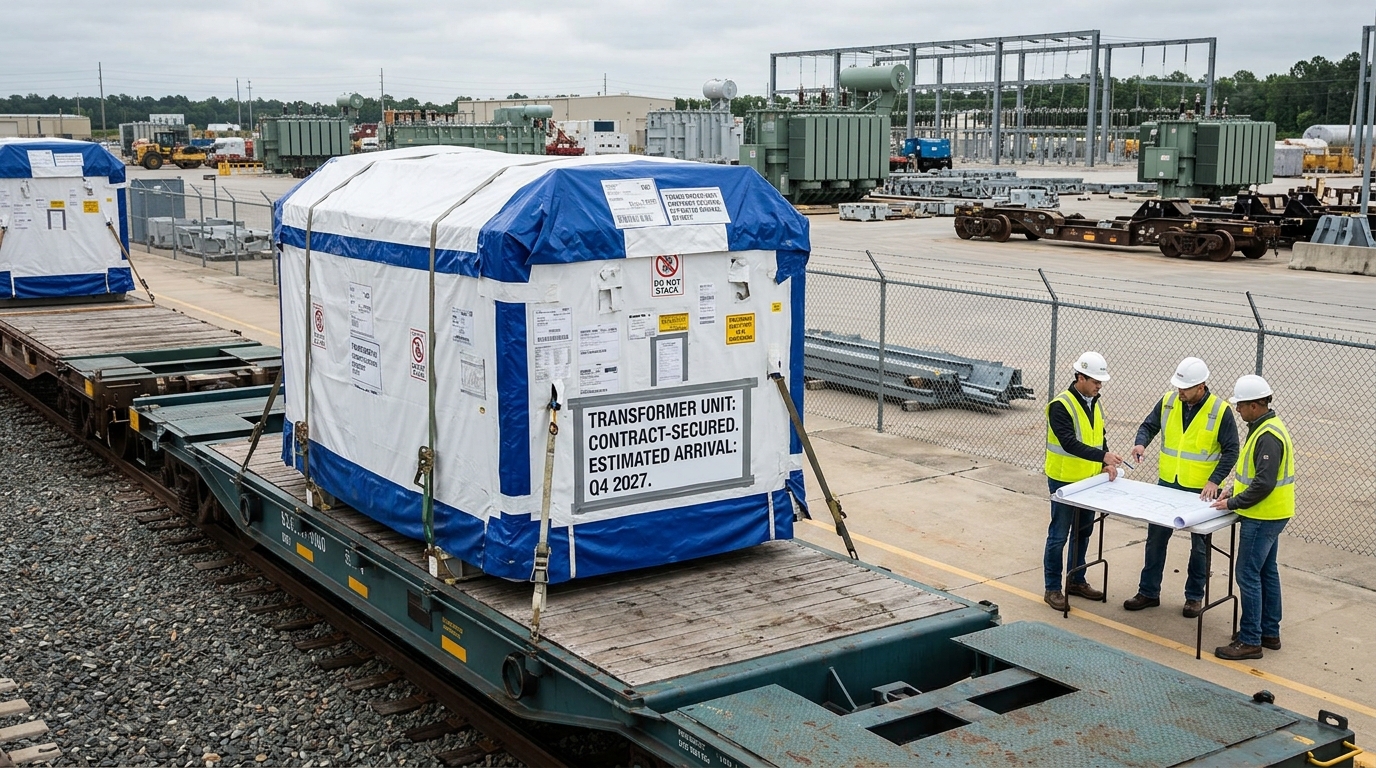
The U.S. grid is not merely aging. It is queuing. Large power transformer lead times have stretched from roughly 12 to 18 months pre-shortage to roughly 30 to 36 months today, based on a DOE-funded national laboratory supply chain gap analysis published in May 2026 and related industry survey data. Generation step-up units now run about 144 weeks on average in commonly cited industry surveys. That is not a procurement inconvenience. It is a structural constraint that has quietly transferred enormous pricing power to a short list of suppliers with long order books.
The utilities that recognized this earliest are no longer buying on purchase orders. California’s Roseville Electric Utility, once ordering a year ahead, is now operating on roughly a three-year timeline to lock down supplies, according to its CEO. The National Infrastructure Advisory Council flagged the dynamic in 2024 and recommended long-term contracts and customer commitments between suppliers and major demand drivers as a policy fix. In 2026, that recommendation has become market reality.
Where the Backlog Sits
Three names control the commanding position. GE Vernova’s total backlog reached about $176 billion at the end of Q2 2026, after a roughly $13 billion sequential increase earlier in the year. The company’s roughly $5.3 billion acquisition of the remaining 50% stake in Prolec GE added about $5 billion of backlog, and management has described Prolec’s Power Transmission backlog as approaching the scale of its Grid Systems Integration business once consolidated. Full-year 2026 revenue guidance has been raised to $45.5 to $46.5 billion, with free cash flow guided to $11.5 to $12.5 billion.
Siemens Energy’s Grid Technologies unit reported a record €51 billion (about $59 billion) order backlog on August 5, 2026, with segment orders rising 28% year over year to about €5.4 billion. Large power transformers were a key driver of that momentum, management said on the call. The catch: Siemens Energy has said its planned transformer and gas-insulated switchgear capacity expansion of about 50% is targeted by 2030. That gap between demand and supply is exactly what sustains pricing power through the end of the decade.
Eaton’s Electrical Americas segment posted record revenue of $4.0 billion in Q2 2026, up 18% organically, with total electrical backlog up 43% year over year. Twelve-month rolling orders in Electrical Americas are up 41%. Book-to-bill sits around 1.3 on a rolling twelve-month basis for Electrical Americas, while management has cited about 1.2 for the Electrical businesses overall. Management is committing more than $1 billion to 24 capacity expansion projects across Electrical Americas, with much of the conversion runway extending into 2027 and beyond.
The Component Layer Below the Transformer
Traders focused only on transformer OEMs are watching one floor above the real constraint. A substation does not energize on a transformer alone. High-voltage bushings, on-load tap changers, protection relays, and switchgear sit in the same elongated queue. A large share of project delays in 2025 and 2026 trace to switchgear and breakers rather than the transformer. Hubbell, whose Utility Solutions segment generated $1.026 billion in Q2 2026 revenue with Grid Infrastructure up roughly 12%, supplies the connectors, insulators, arresters, and cutouts that make a substation buildable and repairable. Its ROIC is consistently in the high teens in company disclosures and investor materials, reflecting durable demand, not cyclical luck.
Pricing across the board has moved structurally. Power transformer prices are up roughly 75% to 77% since 2019 based on widely cited BLS producer price index comparisons and industry survey work; distribution units are often cited as up roughly 78% to as much as 95% over the same period. Grain-oriented electrical steel, a core transformer input, has roughly doubled from 2020 levels in commonly cited industry discussions; copper is higher than 2020 levels, though not consistently up more than 50% versus 2020 depending on the reference month. Section 232 steel, aluminum, and copper duties were modified in an April 2, 2026 proclamation (effective April 6, 2026), and have continued to add cost pressure into metal-heavy electrical equipment supply chains.
Scenario Modeling
Bull Case: ERCOT transmission policy and routing decisions move faster than expected and interconnection and build timelines compress, pulling forward a larger equipment demand wave. GEV moves toward its $200 billion backlog objective on an earlier timetable, and Eaton’s Americas book-to-bill holds above 1.2 through year-end. Pricing remains firm, with GE Vernova management describing 10% to 20% price improvement on new bidding activity versus older backlog benchmarks in early-2026 commentary, sustaining upside margin surprise as backlog converts.
Base Case: Lead times for large power transformers stabilize near 30 to 36 months through 2027 as Siemens Energy, Hitachi Energy, and GE Vernova gradually ramp capacity. Backlog conversion extends delivery windows without clearing them. Eaton and Hubbell continue mid-teens organic growth. Pricing remains elevated but the rate of escalation moderates as incremental U.S. capacity and debottlenecking work show up in deliveries across 2027 and 2028.
Bear Case: Routing, siting, and right-of-way disputes stretch grid expansion timelines, deferring the equipment demand those projects represent. Hyperscalers shift some AI infrastructure capital spending offshore in response to tariff uncertainty, softening U.S. data center-related equipment orders. For GE Vernova’s Gas Power business, management has described data center customers as about 20% of the current gas turbine order backlog, so a data center pause would matter even if traditional utility demand stays solid. GEV Electrification book-to-bill drifts back toward 1.0, compressing valuation multiples that have already priced in scarcity.
Active Trader Framework
The long-cycle backlog structure means these names are less event-driven than most industrial equities. When book-to-bill is 1.2 to 1.3 and capacity is the binding constraint, the surprise risk shifts from demand to execution. Margin compression from factory ramp costs, input cost spikes, or labor shortfalls are the realistic downside vectors. Watch Eaton’s segment margin progression and forward guide commentary each quarter as the cleanest real-time read on whether new capacity is absorbing cost efficiently. For GEV, the Prolec integration pace and Electrification margin expansion are the signals that separate a backlog story from a cash flow story. Position sizing should reflect that these are high-visibility, lower-surprise businesses until supply catches demand, with many catalysts already in the order book rather than in the news cycle.