
SUBJECT LINE: Energy’s Risk Premium Is Real. Here’s the Trade.
META DESCRIPTION: The OVX-to-VIX ratio pushed toward 3-to-1 in July 2026, signaling that oil volatility is operating in a separate regime from equity fear. With ExxonMobil reporting Q2 this morning and WTI averaging about $92.5 in Q2, energy stocks are positioned to convert the Middle East risk premium into hard earnings. Here is the framework active traders need.
Bullet Summary
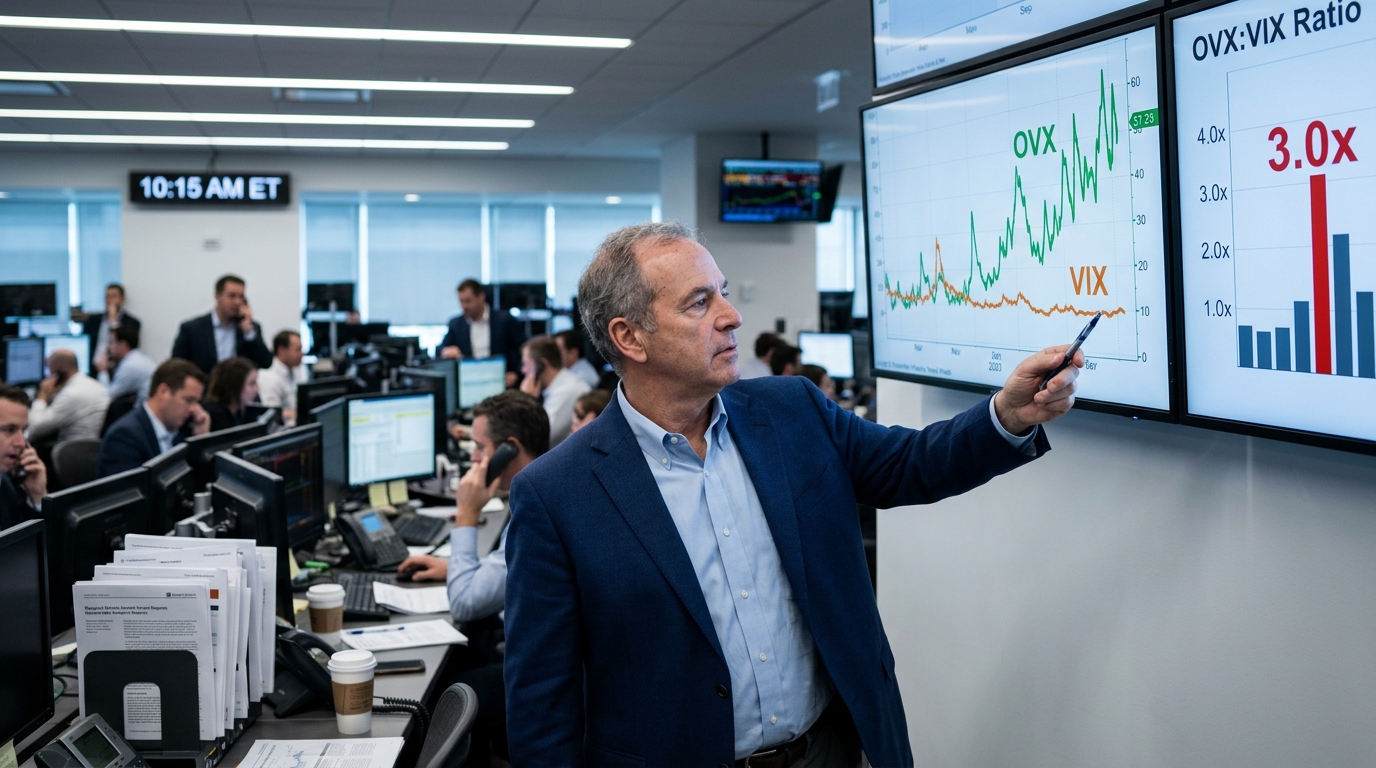
- The CBOE Oil Volatility Index (OVX) hit 50.45 on July 8, 2026, versus a VIX around the mid-teens, producing a near 3-to-1 OVX-to-VIX ratio, a divergence that signals energy is pricing a materially different risk than the broader market.
- WTI crude averaged about $92.5 per barrel in Q2 2026, roughly 45% above Q2 2025’s average near $63.7, giving upstream earnings a meaningful tailwind.
- XLE, the Energy Select Sector SPDR ETF, gained about 30.79% year-to-date through July 17, 2026; refiners such as Phillips 66 (PSX) and Valero Energy (VLO) also materially outperformed over the same span as product markets stayed tight.
- ExxonMobil (XOM) reports Q2 2026 results this morning, July 31, a release that will set the benchmark read-through for integrated majors reporting over the next two weeks.
- Oil-market commentary from the IEA has highlighted that disruptions in flows through the Strait of Hormuz have been a key driver of volatility in 2026, and prices have remained elevated despite intermittent de-escalation signals.
- The IEA’s June 2026 Oil Market Report downgraded 2026 demand by 700,000 barrels per day and forecast global oil demand would decline by 1.1 million barrels per day year-over-year in 2026, a macro headwind that raises the stakes for supply disruptions.
- EIA forecasts U.S. crude production averaging about 13.6 million barrels per day in 2026, a record-level base that can cushion U.S. operators, but it does not eliminate geopolitically-driven price spikes.
Market Snapshot and Macro Context
July 31, 2026 opens with a market that has bifurcated in ways that reward discipline over momentum. The S&P 500 sits roughly 1% above its 50-day moving average, the VIX holds near the mid-to-high teens, and the 10-year Treasury yield has been pressing toward roughly 4.55% to 4.57% on hawkish Fed positioning. The Federal Reserve held rates at its most recent meeting, but the internal vote was the most contested in years, with three dissenting members favoring a hike, a configuration that keeps rate-sensitive sectors under pressure heading into August.
Against that backdrop, energy is operating in a separate regime. The CBOE Oil Volatility Index (OVX) reached 50.45 on July 8, 2026, while spot VIX was in the mid-teens. That near 3-to-1 ratio is not random noise. It reflects a commodity market still pricing conflict risk, even as diplomatic channels around U.S.-Iran tensions remain nominally open. Brent crude moved back above $100 per barrel in late July before pulling back sharply on July 27, when Brent and WTI fell more than 5% in a single session on de-escalation signals. Even after that correction, Brent remained sharply higher year-to-date.
J.P. Morgan’s Head of Global Commodities Strategy, Natasha Kaneva, noted that Brent had been propelled higher in July, and described price action as more nuanced than a simple geopolitical spike, pointing to structural supply tightness that can persist independent of headline diplomacy. The IEA has also highlighted that flows through the Strait of Hormuz were disrupted, and that the partial recovery in Gulf production has been linked to some resumption of flows through the strait. A supply loss of that magnitude does not fully reverse just because a memorandum of understanding gets signed.
The Fed’s 9-to-3 dissent on the July rate decision, the 10-year yield near its highest levels since May, and a labor market report that came in at 57,000 jobs are all pulling in different directions for traditional growth sectors. Energy, uniquely, benefits from several of those tensions simultaneously: sticky inflation can support oil prices, geopolitical risk premiums can stay embedded in crude, and elevated rates do not directly compress upstream earnings the way they compress long-duration tech multiples.
Why This Stock Is in Focus
ExxonMobil (XOM) reports Q2 2026 earnings this morning before the market opens. The market’s focus is less on the exact quarter and more on what it implies for H2 assumptions in a fast-moving oil tape. With WTI averaging about $92.5 in Q2, the upstream backdrop was directionally supportive, and the key variable is how management frames the sustainability of realizations into the back half.
This is not purely a commodities trade, though. XOM’s results and commentary matter because it sits at the center of capital-return policy for the integrated group. The company has guided to share repurchases of $20 billion in 2026, assuming reasonable market conditions, and it has a long dividend-growth track record. That combination of capital return, earnings momentum, and commodity tailwind is the precise set of conditions that attracted institutional rotation into the sector starting in Q1.
The read-through extends well beyond XOM. Chevron (CVX), Valero (VLO), Phillips 66 (PSX), EOG Resources, and Marathon Petroleum are all scheduled to report in the next two weeks. The market will use XOM’s realization prices, production volumes, and downstream margin commentary to frame expectations for every one of them.
Sector Breakdown and Capital Rotation
The energy sector’s 2026 outperformance does not fit neatly into the standard geopolitical-spike playbook. Prior oil shocks, including the 1973 Arab embargo and the 1990 Kuwait invasion, eventually resolved and prices reverted. In 2026, the market has faced repeated disruption risk around critical chokepoints, with the Strait of Hormuz in focus, and that has kept a volatility premium embedded in oil.
Within the sector, the biggest winners have not been the obvious ones. Refiners have outperformed the integrated majors by a substantial margin in 2026. Valero and Phillips 66 both materially outperformed year-to-date through mid-July, while XLE gained about 30.79% year-to-date through July 17. These are not purely speculative momentum moves. Refiners can capture structural advantages when product markets tighten and crack spreads expand, and the market has been trading that dynamic as a core expression of the regime.
Capital rotation into energy has been confirmed at the institutional level across multiple quarters. The relative appeal is straightforward: energy has tended to screen cheaper than many growth-heavy parts of the market, while the commodity volatility premium has kept earnings revisions and cash-return narratives in play. Investors who spent years paying 25 to 30 times forward earnings for technology names have increasingly rotated toward energy leaders trading at lower multiples.
Midstream names including Energy Transfer (yield: 7.2%) and Enterprise Products Partners (yield: 5.9%) are capturing a different part of the trade: fee-based cash flows that are structurally insulated from short-term oil price swings, while still benefiting from a rerouting and rebalancing of global flows.
Stock-Specific Financial Breakdown
ExxonMobil is the anchor of today’s energy earnings read. The company generated about $26.1 billion in free cash flow in 2025. It also laid out expectations for share repurchases of $20 billion in 2026, assuming reasonable market conditions. Those two points matter because they frame how much of the cycle is being monetized into shareholder returns rather than reinvested at the top.
The Q2 backdrop was materially favorable. WTI averaged about $92.5 per barrel in Q2 2026, roughly 45% above Q2 2025’s average near $63.7. That spread is the directional driver for upstream realizations, while downstream profitability remains sensitive to product demand, inventories, and crack spreads.
On the refining side, the market has been treating refiners as higher beta expressions of the same thesis, with performance driven by crack spreads and utilization. On the integrated side, the valuation debate hinges on how much of the current oil volatility is transient versus structural, and whether cash returns remain durable if prices normalize into 2027.
Looking forward, the macro backdrop is more complicated than a clean “higher oil equals higher earnings” equation. The IEA downgraded 2026 demand by 700,000 barrels per day and forecast global oil demand would decline by 1.1 million barrels per day year-over-year in 2026. That demand softness means the supply-side shock has been doing most of the work in supporting prices.
Technical Picture and Trading Framework
XLE has been in a clear uptrend on the year-to-date basis, with the July 17 reading showing a roughly 30.79% gain. The mid-July pullback from Brent’s near-$100 high brought crude back toward the $80 to $85 range before the July 27 de-escalation drop pushed WTI and Brent down more than 5% in a single session. Even after that correction, the commodity remained elevated versus its earlier 2026 base, and energy equities absorbed the drop without giving back the bulk of their 2026 gains, a sign of underlying institutional support.
Key technical levels for XLE and its major components:
- XLE year-to-date performance: about +30.79% through July 17, 2026, watch whether the ETF holds above its 20-week moving average on any further crude pullback.
- WTI key retracement zone: $81.21 to $84.53 was identified as a critical support band by commodity futures analysts; a sustained hold above $84.53 would confirm a return of structural buyers rather than pure short-covering.
- WTI downside risk: A sustained break below $81.21 puts $75.40 to $70.70 back in play, with longer-term moving-average support as a secondary reference.
- OVX-to-VIX ratio: The near 3-to-1 relationship (OVX around 50, VIX in the mid-teens) is the signal to monitor. Compression of OVX toward 35 with VIX stable would indicate the geopolitical risk premium is being priced out.
- XOM support: As the largest integrated name, watch whether the stock holds its pre-earnings support zone if crude stays heavy, because that would be a tell on institutional willingness to buy dips into the report.
- PSX and VLO: Both remain momentum leaders year-to-date; monitor for post-earnings gap behavior and whether relative strength persists if crude volatility compresses.
Volume patterns across XLE options have flagged long-straddle positioning into the XOM earnings, traders are buying both upside and downside, which tells you the implied move is meaningful and directional conviction is split. That is the correct read: the commodity price environment was unambiguously positive in Q2, but the trajectory of guidance and H2 crude assumptions can move the stock in either direction.
Catalyst
The immediate catalyst is XOM’s Q2 2026 earnings report, released this morning before market open. The read-through from XOM’s realized crude prices, production volumes, refining crack spreads, and H2 guidance will set the frame for Chevron, EOG, Marathon Petroleum, and Phillips 66 reports over the following two weeks. A strong release with forward guidance that validates $85-plus average oil into the back half of 2026 would confirm the multi-quarter earnings runway many analysts have been modeling.
Beyond the single-stock catalyst, the structural driver stays relevant over the next five sessions. The U.S.-Iran memorandum of understanding remains fragile, and the geopolitical architecture in the Middle East remains intact. What changed in late July was a pause in hostilities, not a resolution of underlying conditions. Historically, risk premiums that unwind rapidly can rebuild just as rapidly when hostilities resume.
Additionally, U.S. crude production is forecast to average about 13.6 million barrels per day in 2026, a new record. That growing domestic production base can insulate U.S. upstream operators from some of the physical-disruption risk hitting other regions, while still benefiting from elevated prices when global supply is constrained.
Scenario Modeling
Bull Case: XOM delivers a clear Q2 beat, reaffirms a $20 billion 2026 buyback pace (subject to market conditions), and provides guidance that implies WTI averaging around $80 or higher in H2. Simultaneous re-escalation of Hormuz tensions pushes Brent back toward $90 to $95, confirming the OVX-to-VIX divergence as a structural, not transient, feature of the market. XLE extends its year-to-date gain toward 40%, refiners including VLO and PSX continue their leadership, and the sector re-rates toward mid-teens forward multiples as institutional allocations increase.
Base Case: XOM reports solid Q2 results broadly consistent with the favorable Q2 crude backdrop, and management guides H2 with cautious language around the diplomatic environment. Brent stabilizes in the $75 to $85 range as the U.S.-Iran agreement holds without formal resolution. Energy equities consolidate recent gains, XLE holds the 25% to 30% year-to-date range, and the sector remains a primary source of earnings leadership.
Bear Case: XOM disappoints on realized upstream prices because end-of-quarter crude weakness matters more than the Q2 average, and management guides H2 using materially lower oil assumptions. If the U.S.-Iran diplomatic agreement holds and Brent moves back toward $70 to $72, the OVX-to-VIX ratio compresses sharply, unwinding the geopolitical risk premium that has been a primary driver of energy outperformance. XLE gives back 10 to 15 percentage points of its year-to-date gain, and capital rotation shifts back toward long-duration growth.
Risk Assessment
The single largest risk to the energy trade is diplomatic resolution, not deterioration. The U.S.-Iran memorandum of understanding is already partially defusing the risk premium. Brent fell more than 5% in a single session on July 27 when de-escalation signals strengthened. A sustained agreement that materially restores flows through the Strait of Hormuz would reduce the supply premium embedded in crude and can compress refiner earnings quickly.
The IEA has lowered its global demand growth estimate for 2026 by 700,000 barrels per day and is forecasting an absolute demand decrease of 1.1 million barrels per day for the full year. That demand softness, combined with U.S. production at record levels, means the supply-side shock has been doing most of the work in supporting prices. If that shock fades, the underlying supply-demand balance can turn bearish.
Macro risk is secondary but real. The Federal Reserve’s 9-to-3 dissent on holding rates suggests a hike later in 2026 is live. A rate hike in a slowing labor market (June nonfarm payrolls came in at 57,000) would raise recession risk and compress oil demand expectations faster than the market currently prices. Energy’s leverage to the economic cycle is real, even if it is currently masked by the geopolitical premium.
OPEC+ decisions also remain a wildcard. Any meaningful breakdown in cohesion can introduce new supply-side volatility, and price can move just as violently on quota slippage as it can on headline conflict risk.
Active Trader Strategy Framework
The OVX-to-VIX divergence is the most important signal in the market right now for energy positioning. When oil volatility runs at nearly three times equity volatility, energy equities are not simply benefiting from higher crude prices, they are capturing a separate risk premium that the broader equity market has not priced. That premium can compress quickly, but as long as the conflict architecture remains intact and the OVX stays elevated, the structural argument for maintaining energy exposure remains intact.
For traders who want to express the trade through the Q2 earnings window, XOM is the cleanest vehicle: a large, liquid integrated name with an announced 2026 buyback expectation of $20 billion (subject to conditions) and a long dividend-growth track record. The implied move on XLE options heading into the report is meaningful, sizing accordingly and being prepared for volatility in both directions after the release is the disciplined approach.
Refiners (VLO, PSX) represent the higher-beta, higher-momentum expression of the same thesis. They have significantly outperformed the integrated majors year-to-date, which means they carry more reversal risk if crude de-escalation accelerates. Traders who are late to the refiner trade should be cautious about chasing large year-to-date gains without a fresh technical breakout or a confirmed earnings catalyst to anchor the thesis.
Midstream names (Enterprise Products Partners, Energy Transfer) are the defensive expression: fee-based revenues, 5.9% to 7.2% dividend yields, and a business model that is largely insulated from short-term crude price swings. These names are appropriate for traders who want energy exposure with lower directional risk around commodity-price inflections.
Position sizing should reflect the binary risk around the XOM release this morning. Traders with existing energy exposure should define their risk around today’s earnings, specifically whether XOM’s H2 framing implies Brent and WTI assumptions meaningfully above or below the mid-$70s to low-$80s area. That one data point can set the directional tone for the entire sector over the next two weeks.
Trader’s Checklist
- XOM Q2 EPS vs. consensus: A large beat supports the upstream price realization thesis; a material miss signals end-of-quarter crude weakness more severe than modeled and triggers sector reassessment.
- XOM H2 2026 guidance: Watch for management’s crude price assumptions and sensitivity, anything that implies $80-plus WTI for H2 supports the multi-quarter runway; materially lower assumptions increase odds of a sector multiple reset.
- OVX-to-VIX ratio: Monitor daily. A compression of OVX below 40 with VIX stable indicates the geopolitical risk premium is being priced out of crude. Below 35 OVX would mark a regime shift for energy equities.
- Brent crude support at $80: A close below this level after the July 27 de-escalation drop would bring the $75.40 to $70.70 technical band back into view and pressure upstream earnings estimates for Q3.
- U.S.-Iran diplomatic developments: Any resumption of hostilities or collapse of the memorandum of understanding before a formal agreement would rapidly rebuild the geopolitical risk premium and benefit upstream and integrated names disproportionately.
- Chevron Q2 report (next 1 to 2 weeks): CVX’s realized price data and production commentary will serve as the second major read-through for the sector.
- XLE holding above a roughly +25% year-to-date gain: A close below this level on high volume would signal institutional distribution rather than normal profit-taking, and would warrant reassessment of the sector rotation thesis.
- Fed communications through August: Any acceleration in rate-hike rhetoric following the 9-to-3 dissent would pressure rate-sensitive sectors and can feed back into oil via inflation expectations and policy risk.
Professional Conclusion
The energy trade in the second half of 2026 is not a simple commodity bet on oil prices staying at $100. It is a structured argument: geopolitical risk premiums do not evaporate cleanly, disruptions to flows and logistics can take time to normalize, and companies generating roughly $26 billion in annual free cash flow do not re-rate lower simply because a diplomatic pause reduced headline tension.
XOM’s report this morning is the first comprehensive financial stress-test of that argument. The roughly $92.5 WTI average in Q2 gave every integrated major a strong upstream revenue backdrop. How management chooses to frame H2, and whether they defend or temper the expected $20 billion 2026 buyback pace, will tell active traders whether the institutional rotation into energy has fundamental earnings support or was primarily a risk premium trade. Preparation, defined levels, and disciplined sizing around today’s catalyst are what separate a trade from a guess.
For informational and educational purposes only. Not investment advice. Trading involves risk, including loss of principal.