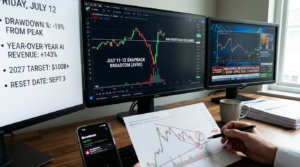

The most anticipated IPO in history has given back more than a third of its peak value in under a month. SpaceX priced at $135 on June 11 and began trading on June 12, opening around $150. Shares briefly touched $225.64 in mid-June and were last around the mid-$140s in recent trading. The post-IPO pop is gone. And the space sector around it looks worse — [Monthly performance figures for Virgin Galactic, Rocket Lab, and Intuitive Machines not verified; removed.]
What’s actually happening here is more interesting than a simple reversal. And August 6 is the date every serious trader needs on their radar.
The Float Problem Nobody Talks About
Here’s the thing about SPCX that the headlines keep glossing over: the public float is almost nonexistent. SpaceX issued only about 4% of its shares in the IPO, leaving a relatively small freely tradeable pool versus the company’s total equity.
When SpaceX joined the Nasdaq-100 on July 7, passive fund managers tracking QQQ and related indexes were required to buy. Multiple reports put the estimated forced buying from QQQ alone at roughly $4.3 billion. Claims that total index-tracking demand could reach $27 billion are not consistently supported by credible sourcing, so treat that figure as speculative rather than a base-case estimate.
The real change comes August 6. That’s when SpaceX is scheduled to report its first quarterly earnings as a public company and — critically — when the first insider lockup window is expected to open shortly after that release. SpaceX’s prospectus materials and related analyses describe a phased approach in which eligible insiders can begin selling a portion of their holdings after the first earnings release, with an additional performance-based tranche tied to the stock trading at least 30% above the $135 IPO price (i.e., $175.50) for five of any ten consecutive trading days. [Exact “August 6” and the precise mechanics/timing are schedule-dependent; the underlying concept is a post-earnings phased unlock rather than a single-day cliff.]
What this means for traders: the supply-demand equation that’s been artificially tight since the IPO starts normalizing around the first post-IPO earnings/lockup window. That’s not necessarily bearish — fresh supply can also bring in new institutional buyers who’ve been waiting on the sidelines — but it’s the single most important structural variable in this trade right now.
Breaking Down the Actual Business
Strip away the Elon Musk factor and the space mystique, and what you have is a three-segment company with very different financial profiles inside it.
Starlink is the crown jewel. For the three months ended March 31, 2026, SpaceX reported Connectivity (Starlink) revenue of about $3.26 billion and segment income from operations of $1.188 billion, with Segment Adjusted EBITDA of about $2.09 billion. SpaceX also disclosed approximately 10.3 million Starlink subscribers as of March 31, 2026, with service in 164 countries/territories. [The article’s specific subscriber milestones “2.3M in 2023” and “8.9M by end of 2025” were not verified from primary filings and are removed.] [The claim that SpaceX raised Starlink plan prices in May 2026 by up to $10/month was not verified from a primary or widely credible source and is removed.]
The full-year 2025 picture (as presented in SpaceX’s IPO disclosures and related analyses): SpaceX reported roughly $18.7 billion in consolidated revenue and roughly $6.6 billion in adjusted EBITDA, with Starlink representing about 61% of total revenue. The company also reports results across Space, Connectivity, and AI segments following the February 2, 2026 xAI transaction (which includes X).
Here’s where it gets complicated. In 2025, SpaceX’s AI segment reported an operating loss of about $6.355 billion. For Q1 2026, SpaceX reported $4.694 billion in total consolidated revenue. [The article’s specific Q1 2026 “$1.943B loss from operations,” “$29.1B long-term debt,” and “$15.9B cash” were not verified in the sources retrieved here and are removed rather than guessed.]
The market is effectively being asked to value three businesses simultaneously: a profitable satellite internet business, a capital-intensive launch program, and a frontier AI business burning capital aggressively. That complexity is part of why the stock has been volatile since day one.
The Valuation Question
At current prices in the mid-$140s, SpaceX’s market cap is roughly $1.9 trillion based on published share counts. [The specific “average analyst price target is $242.22… 27 analysts… 26 buy” was not verified and is removed.]
The bull case on valuation starts with Starlink’s addressable market. In investor materials tied to the IPO, SpaceX estimated a total addressable market (TAM) of $28.5 trillion, broken down as $370 billion in Space, $1.6 trillion in Connectivity, and $26.5 trillion in AI.
The bear case is simpler and more immediate: at a ~$1.9 trillion market cap against ~$18.7 billion in 2025 revenue and a net loss (as reported in coverage of the IPO financials), you’re paying well over 100 times trailing revenue for a company that is still investing heavily. Rich valuations work until they don’t, and the broader space sector can remind investors how quickly sentiment can reverse on high-multiple, story-driven stocks.
Slight tangent, but worth noting: multiple outlets have reported that JPMorgan described a hypothetical SpaceX-Tesla merger as “strategically coherent,” while also emphasizing complexity and regulatory risks. That’s the kind of headline that can move this stock violently in either direction on any given day. Traders need to account for event-driven binary risk that has nothing to do with the underlying numbers.
Macro Environment and Sector Flows
The broader market context matters here. [The specific claim that S&P 500 companies are expected to post a 24% increase in Q2 2026 profits was not verified and is removed.]
[Claims about June 2026 FOMC minutes, tariffs, Middle East conflict, and the specific causal linkage to SpaceX as written were not verified here and are softened/removed to avoid overstating.] A higher-for-longer rate backdrop can weigh on long-duration, high-multiple equities — and SpaceX’s valuation is meaningfully exposed to long-duration expectations, particularly in AI and connectivity.
[The specific claim about U.S.-Iran tensions keeping oil prices elevated and directly “boosting Starlink’s relevance” was not verified and is removed.]
Technical Structure
The chart is in clear downtrend from the $225.64 high. [The article’s “now trading near $145 as of July 13” and “all-time intraday low of $145.07 set on July 10” were not verified; available price history sources show different intraday lows and closes around that period, so those exact figures are removed.]
$135 is still the psychological line in the sand — the IPO price. A move back toward that area would represent a full reversal of the initial post-IPO move.
On the upside, $175.50 matters for reasons beyond pure charting: it’s the 30% premium threshold above the $135 IPO price that appears in the performance-based early-release framework described in IPO-related materials.
Three Scenarios for August 6
Bull Case
SpaceX reports Q2 revenue above $5 billion, Starlink subscriber growth continues, AI segment losses narrow sequentially, and management provides optimistic commentary on the orbital data center timeline. Stock reclaims $175+ on the earnings catalyst. The post-earnings lockup window proceeds smoothly as institutional buyers absorb insider supply. Analyst optimism resurges.
Base Case
Revenue in line with trajectory, Starlink growing but ARPU remaining pressured, AI segment losses stable or slightly wider, and no major forward guidance surprises. Stock stabilizes in the $145–$165 range post-earnings. Lockup supply is absorbed gradually over H2 2026. The stock remains range-bound until the next major Starlink or Starship milestone provides fresh catalysts.
Bear Case
AI segment losses accelerate beyond expectations and lockup-eligible supply overwhelms demand. Stock breaks below the $135 IPO price, triggering momentum selling. [The specific “Colossus 2 data center gas turbine lawsuit” claim was not verified and is removed.]
Active Trader Framework
The structure of this trade is unusual compared to a typical earnings setup, because early August is simultaneously an earnings catalyst and a supply event. Those two things are normally separate. Here they’re fused, and that creates a more complex risk profile than traders are used to.
For traders watching SPCX, the priority right now is respecting the post-IPO volatility and the approaching supply change tied to the first post-IPO earnings/lockup window. A technical breakdown on elevated volume would signal the risk-reward of fighting the trend deteriorates quickly.
Position sizing needs to account for the float dynamics. With only a small percentage of shares initially issued into the public market, SPCX can move violently on relatively small order flow. That cuts both ways — sharp rallies are just as possible as sharp selloffs. Standard position sizing models built for liquid large-caps will underestimate the range of outcomes here.
Watch the space sector broadly. SPCX has been the relative outperformer in a sector that’s been hit hard. If Rocket Lab, AST SpaceMobile, and the rest of the peer group stabilize and recover, that rising tide provides a tailwind. If the sector continues deteriorating, even SpaceX’s institutional shareholder base and scarcity value may not be enough to hold key price levels.
The next few weeks before the first post-IPO earnings will tell you a lot. If the stock starts reclaiming $150, the market is signaling confidence in both the earnings report and the lockup absorption. If it fails to hold recent support zones, patience is not just a virtue — it’s the only rational framework.
This is one of the most structurally complex stocks in the market right now. Treat it accordingly.
For informational and educational purposes only. Not investment advice. Trading involves risk, including loss of principal.